
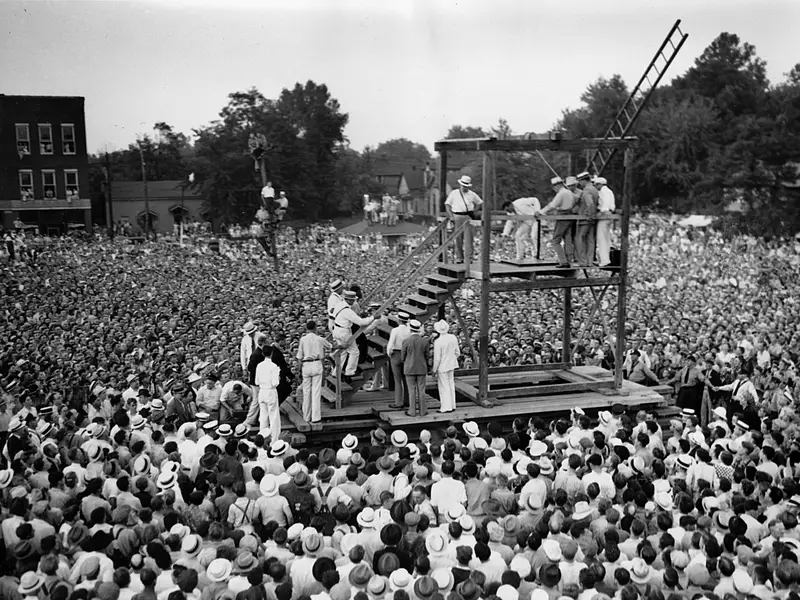
Depicted Above: Sarat, Austion. “Living in Capital Punishment Limbo” 11 Apr. 2022: Original Source
“The death penalty is not about whether people deserve to die for the crimes they commit. The real question of capital punishment in this country is, Do we deserve to kill?”
― Bryan Stevenson
Keep In Mind
This question strikes at the core of the controversy surrounding capital punishment in the U.S., it shifts the focus from retribution or desert to something deeper and more unsettling: the moral legitimacy of the state to take a life at all. Rather than simply asking whether a particular person deserves execution, this quote challenges us to consider whether our society, with its imperfections, inequalities, and history of biased justice, deserves to wield the ultimate punitive power.
Introduction:
Death sentence: A frightening and intimidating topic where an individual receives life-threatening punishment, typically years after their sentencing. This form of punishment is labeled as Capital punishment and has occurred for almost five decades, it is exercised only in extreme cases which in our databases appears to be murder. There have been several executions in the United States, since the death penalty’s reinstatement in 1976; however, the frequency of these executions are unevenly spread and inconsistently carried out throughout our country. This variability raises questions about what makes certain regions impose more executions than others. Are there any biases that influence judges and juries decision to send someone to death row? What are the social environments and attitudes surrounding those regions? Are there racial and gender discriminations? Our project examines the extent to which of these factors, race, geographic region, gender, or other influences shaped death penalty outcomes in the United States between 1976 to 2016. We narrowed our focus to Texas because it has the highest number of executions during this time period, as clearly reflected in our visualizations (see Map #1). We used a Texas dataset, a state and county level execution records dataset, and secondary sources from historical reporting to support our project. This allows us to highlight relevant patterns over time and determine the prevelance of any biases.
Literature Review:
Depicted Above: Opinion, When We Kill, “New York Times” 14 June 2019: Original Source
This literature review examines scholarship suggesting that implicit and structural biases influence which defendants receive death sentences. Naturally, crime severity is a primary factor: defendants must commit extreme harm, such as torture, premeditation, or multiple killings, to be considered eligible for the death penalty. While crime severity establishes eligibility for the death penalty, our data analysis along with scholarly literature indicate that race, geographic region, and gender significantly influence how capital punishment is applied in practice.These variables consistently shape sentencing outcomes, suggesting that the application of the death penalty is influenced by the severity of the crime just as much as general systemic biases embedded within the justice system. Many of the studies we read argue that racial disparity significantly influences their probability of receiving the death sentence or executions penalty. Although White individuals are the largest group executed, our secondary sources indicate that Black defendants are disproportionately sentenced to death, given the fact that they are a significantly smaller portion of the United States population than Black people are.
Our sources reveal that judges and juries are naturally, based on previous years of data are biased in their rulings. When examining factors such as the defendant’s race, the victim’s race, and the regional concentration of death sentences, specifically in Southern states like Texas, clear patterns of disparity emerge. Studies by Baumgartner et al. (17) demonstrate that cases involving White victims are more likely to result in death sentences, alongside Samara et al. (7) who highlights the persistent overrepresentation of Black defendants on death row.
Additionally, the Southern region, Texas specifically continues to account for an overwhelming share of executions and death sentences, reiterating the geographic concentration of capital punishment in the United States. However, other scholarship cautions that race does not solely dictate the court’s outcome. Instead, general social attitudes toward race, combined with county and state level differences in prosecutorial discretion, jury composition, and political climate, shape capital sentencing outcomes. Petersen (1) suggests that local legal cultures and community sentiment can subtly influence rulings, while Baumgartner et al. (15) and Samara et al. (5) show that geographic variation and racially-motivated patterns intersect to marginally but consistently affect who is sentenced to death and who is ultimately executed. As we mentioned previously, Texas has carried out more executions than any other state, and its frequent appearance throughout our bibliography reinforces its centrality in nationwide death penalty scholarship. The repeated spotlight on Texas implies the need for closer examination, as researchers often use the state as a case study to analyze sentencing patterns and jury decision-making, and structural biases integrated within county-level laws and capital punishment procedures (Phillips 9).
Significance:
Along with race, some scholars find that disparities in the imposition of capital punishment are not limited to just one stage in the process; rather, they write that gender and political climate are factors that influence decisions before the final sentence is even imposed through charging decisions, pretrial treatment and prosecutorial discretion (Free 5, Baldus et al. 10). Other scholars analyzing the social and political side of this topic feel tha racial stereotypes and public opinion continue to shape support for the death penalty and reinforce unfair outcomes and decisions (Unnever and Cullen 12, Peffley and Hurwitz 7). Additionally factors like victim status, age, gender and even social hierarchy of those attribute play a factor just as prominent as race (Phillips 9, Pena 4).
Generally speaking, there is some scholarly consensus that race plays a role in capital punishment decisions, though, like many conceptual topics, there are minor disagreements about how that influence operates. On one hand, some researchers argue that race is the most significant factor in determining capital punishment outcomes, pointing to patterns of unequal treatment of Black defendants and defendants accused of killing white victims (Brock et al. 20. On the other hand, other scholars emphasize geographic variation, arguing that prosecutorial practices and regional political environments shape whether racial disparities are intensified or minimized in specific jurisdictions (Petersen 3). Overall, race can be a central factor, but its effects may be magnified through local institutions or regional legal systems rather than appearing uniformly across all jurisdictions.
There are also discrepancies in which stage of the death penalty process scholars see as the most unequal. Some works focus on death sentencing itself, while others argue that inequality begins much earlier in criminal processing or continues after sentencing through post-sentence outcomes on death row (Petrie and Coverdill 10). Many sources highlight harsher racially-skewed outcomes overall, some findings complicate a straightforward interpretation. For example, Petrie and Coverdill’s work on Texas suggests that race still shapes who leaves death row and how, but not always in the exact same way as sentencing studies predict. Likewise, while many scholars focus on race and region, others stress different explanatory factors such as victim social status, cognitive heuristics in jury decision-making, or broader public attitudes toward punishment (Phillips 4). Zimmerman’s study on execution methods and deterrence also stands apart from the rest of the literature by shifting attention away from racial and regional inequality and toward policy effects of execution methods, showing that not all death penalty scholarship is centered on fairness and disparity in the same way (Zimmerman 13).
Commonalities:
Conclusively, a fairly consistent pattern is apparent in United States capital punishment as it reflects larger racial and regional inequalities rather than behaving as a purely objective legal punishment. Our secondary sources also consistently suggest that death penalty decisions are shaped by systemic factors, including the race of victims, prosecutorial decision-making, and local political conditions, particularly in southern states such as Texas. Also, legal precedent cases, such as McCleskey v. Kemp, further illustrate how these structural influences persist within the capital punishment system (Keys and Maratea 16). Also many other authors agree that Texas serves as one of the clearest examples of how these inequalities persist over time, making it essential in analyzing how frequent executions and sentencing disparities occur (Brock et al. 19). Capital punishment cannot be fully understood by looking solely at individual cases, one must also consult scholars and how they may show how larger factors like race, institution, and regional histories dictate who is most vulnerable to the harshest punishments (Unnever and Cullen 7). More research is still needed on how race, region, and gender impact this topic (Niven 24). How do racial disparities change depending on place and historical period? Why is Texas so big on the use of capital punishment? These are some questions to think about.
As a group, we want to find any main factor that plays a role in the decision for the death penalty so we can help others understand that the death penalty is more than just a legal punishment for horrible criminal activity, it can double as a social, regional or hierarchy phenomenon. With the visualizations across the United States and seeing our timeline, our project highlights how executions have been concentrated in specific places like Texas and other southern states and among specific ethnic populations and hierarchies. Our comparison between Texas and the rest of the United States is significant, as it helps show whether Texas is simply an extreme example of a national trend or a distinct case shaped by its own political and legal history. The project is more broadly a good example of justice and inequality in the United States too.
Our Visualizations and Maps
Maps and Visualizations
Data visualizations and maps help reveal trends and relationships that are difficult to see in our raw numerical dataset, making complex information easier for audiences to interpret.
Texas Death Penalty Distribution
View our map and analytical reasoning surrounding Texas’ significant lead in Death Penalty Executions and racial implications.
United States Death Penalty Distribution
Find Nation-wide trends of those that received the Death Penalty and how other States imitate national trends.

Race and Region Influence Death Penalty
See how race and region intersect to influence the likelihood of individuals receiving the Death Penalty.

Death Penalty Executions by Defendant and Victim Race in the United States
This chart shows that executions in the U.S. are far more likely in cases involving white victims, demonstrating a strong race-of-victim effect in capital punishment.

Executions in United States by Gender
View data on how an individual is more likely to be executed for being a male in the United States from 1976 to 2016 than female.

Geographical Clustering of Execution
Southern regions are drastically more likely to carry out executions that other regions, making it significantly more likely for an individual to receive the death penalty by simply just committing the crime there.
Southern Regions Favor the Death Penalty

The United States dataset shows 803 executions of White defendants, 495 Black defendants, and 120 Hispanic defendants, with much smaller numbers for Native American (16) and Asian (6) individuals. Although White defendants are the largest group number, Black defendants represent a disproportionately large share relative to the United States population size. African Americans make up roughly 13% of the U.S. population but are interestingly enough 34% of those executed since 1976, demonstrating a significant racial imbalance in capital punishment outcomes.
The Texas dataset shows 241 White executions, 197 Black executions, and 102 Hispanic executions. When compared to national totals, the regional influence of Texas becomes clear. Texas single handedly accounts for about 40% of all Black executions nationwide (197 of 495) and about 85% of all Hispanic executions (102 of 120). Despite White Americans being the majority population group, Black executions in Texas considerably approach the number of White executions even though Black residents make up a much smaller share of the population. This visualizations illustrates how a single state can significantly skew national execution statistics. Given the skewed data in Texas, capital punishment outcomes are definitively shaped by structural racial inequalities within the justice system. Baumgartner, Grigg, and Mastro even add on that executions in the United States are overwhelmingly influenced by the race of the victim, finding that although Black individuals make up about 47% of homicide victims, they represent only 17% of victims in cases that lead to execution, alluding to this idea that crimes against White victims are more likely to result in death sentences (Baumgartner, Grigg, and Mastro 14). Crimes that have Black victims do not weigh in as significantly, otherwise they would also be a majority or considerable amount in the victims’ races, and as we can see by this visualization, they do not.
Furthermore, our research, and subsequent articles focusing specifically on Texas highlights how these disparities appear within specific jurisdictions. Brock et al. found that defendants accused of killing White victims are significantly more likely to receive the death penalty, especially when the defendant is Black or Hispanic, demonstrating how racial dynamics have some impact on prosecutorial and jury decision-making (Brock et al. 160–162). Other scholarship shows that inequalities surpass race. Phillips’ analysis of Harris County, Texas demonstrates that a victim’s social status, such as education level, marital status, or lack of criminal history, can increase the likelihood that juries impose the death penalty, revealing how social hierarchies shape sentencing outcomes (Phillips 812–815).Naturally, minorities and people of color have historically had fewer opportunities to attain socially valued markers of status, which can make White victims appear more sympathetic to juries and bias sentencing decisions toward the death penalty.
Earlier research also shows that disparities emerge long before the execution stage. Baldus et al. argue that institutional factors such as prosecutorial discretion and local political climates shape death sentencing outcomes (Baldus et al. 690–695), while Free finds that racial bias appears in earlier stages of the criminal justice process such as bail decisions and charging practices (Free 205–208). Collectively, this scholarship suggests that racial disparities in executions exist nationally but become particularly pronounced in certain jurisdictions where legal structures and prosecutorial practices propel these patterns.
Executions via Heatmap by Race and Region of the Death Penalty

Race and region collectively influence the amount of people executed from 1976 to 2016 in the United States. The death penalty is not fairly applied to all races, by this we mean, certain races experience a higher frequency in receiving the death penalty than others. In our Region × Race heatmap, the proportion of executions is highly concentrated within each respective race and its intersection with the region. This heatmap showcases that the southern area have high executions across all races while the Northeast has low executions in general. In other areas, their total execution amount is small and there is low-intensity in those blocks, meaning low numbers are being carried out. However in the same area, different races have shown different amounts of racial execution. Across all areas, White individuals have the highest rate of execution, and Black individual are the second. This is very interesting considering that Black people are not the majority in the United States, proportionately, they should have a significantly lower amount.
These results demonstrate a clear regional and racial imbalance in executions. Based on the heatmap, it can be inferred that both the geographic location and the race of the defendant in each case influence execution outcomes. The South appears to have the most significant impact, as it shows both the highest concentration of executions and the most pronounced racial disparities. This pattern is consistent with Petersen’s findings. In his study of death sentencing in California, Petersen concludes that capital punishment outcomes vary by region and that racial disparities are influenced by local legal and institutional contexts (Petersen 25. Our heatmap reflects a similar pattern: geographic regions with higher execution rates also reveal stronger racial disparities in sentencing outcomes.
Defendant and Victim Race Trends in the United States
The victim race bubble map shows an imbalance of the cases that lead to execution. Cases involving White victims make up for the largest share with 1087 cases, or 75.18% of the total. By comparison, cases involving Black victims account for 192 cases (14.37%), Latino victims 94 cases (7.97%), Asian victims 22 cases (1.53%), and Native American victims only 3 cases (0.21%). Although the chart has some mixed-race victim categories, they are outlier cases. The visualization shows that the executions are heavily concentrated in cases with White victims, suggesting that the victims race has a strong influence on which murders are most likely to result in the death penalty.It should also be noted that there is a null category in the bubble chart as well. In the database, there are some columns where the victim race is blank, this is when they are unable to identify the victims or they are a serial killer with 100+ murders.
This pattern is important in our research, as it suggests that the death penalty is not applied fairly across all homicide cases. Even though homicide victims in the United States are racially diverse, the cases that lead to execution are disproportionately those with White victims. This shows that the United States criminal justice system appears to weigh the victims of the races differently. In this visualization, the difference is alarming, as White victims are not only the largest category, but they are the majority, which points to an imbalance. Research supports our interpretation of data, as The Death Penalty Information Center notes that more than 75% of death row defendants who have been executed were sentenced for killing White victims, however, in the record of all murders that have made it to court about half of those cases have a person of minority murder. This evidence strongly supports the pattern in the visualization, murders who attack people of color or other marginalized groups are getting away with lighter punishments, whereas those who kill White people are pushed into the light.
Executions in United States by Gender
The visualization of executions by gender between 1976 and 2016 shows a striking imbalance: nearly all executions during this period were carried out against male defendants. In the modern era of the death penalty, approximately 98–99% of executions have been men, while women represent only about 1 to 2% of those executed (Capital Punishment in the United States). This huge disparity suggests that gender plays a significant role in the likelihood of receiving the death penalty and the chart reflects this pattern clearly, with male executions overwhelmingly outnumbering female executions.
Scholarly literature also supports the idea that gender influences capital punishment outcomes. David Niven argues that gender bias exists in death penalty cases, demonstrating that male defendants are far more likely to face death sentences than female defendants. Niven supports this claim by analyzing over 14,000 Texas cases and finding that prosecutors sought the death penalty significantly more often in cases involving male defendants than female defendants (Niven 1). This is also due to the implicit violent natures of men that the media pushes onto the defendants, it is much easier to believe (especially in these southern states) that men are capable of committing violent crimes more than women are (Niven 3). This evidence is important because it provides empirical confirmation that gender disparities are not simply random but are embedded in prosecutorial practices and legal decision-making.
Other research suggests that gender disparities in capital punishment intersect with stereotypical structural biases within the criminal justice system. Baldus et al. argues that death sentencing outcomes are significantly influenced by institutional factors (local legal structures) rather than purely focusing in on the severity of the crime (Baldus et al. 4). Along those lines, authors Keys and Maratea highlight how systemic biases within capital punishment law, including the legacy of McCleskey v. Kemp, have made it difficult to challenge unequal sentencing outcomes, allowing disparities based on race, class, and other social factors to persist (Keys and Maratea 1). Essentially in the McCleskey v. Kemp case it was extremely difficult to overturn or contest potential biases within case law, making those that are challenging these inequalities apply a large amount of effort, with often little reward (Keys and Maratea 1).
Collectively, through our visualization and secondary literary sources, it is indicitative that gender considerably influences death penalty outcomes in the United States. Male defendants are overwhelmingly more likely to be executed than female defendants, suggesting that social perceptions of gender, prosecutorial decision-making, and structural legal biases all contribute to the unequal application of capital punishment.
Geographical Clustering of Executions in the United States
Across each ten-year period shown in the execution states visualization, Texas consistently records the highest number of executions among U.S. states. In the earlier period (around 1977–1987), Texas already led other states, though the gap between Texas and states such as Florida, Louisiana, and Georgia was small, Texas has impressively never lost its lead in the most executions within a state.
In the later years, specifically the second and third periods (1987-2007), Texas had a noticeable difference from other states. Florida’s count has decreased to 4th place and other southern states began paling in comparison to the numbers that Texas was putting up. This difference between states has becomes much larger in the later period (around 2007–2016). Expectingly, Texas’s execution count rises dramatically, while most states remain far lower. After reviewing our secondary sources it is evident that this is due to the political environment and support Texas has received from its people, contrasting the opinion of other citizens in their respective states (Anderson 5). This pattern indicates that Texas applies the death penalty more frequently than other states, showing strong regional variation in capital punishment practices within the United States.